
System Architecture Overview
Yoctobe Medical Instrument Middleware employs a sophisticated multi-layer architecture designed for maximum reliability and throughput. The system processes data through distinct stages, ensuring data integrity and proper format conversion at each step.
Core Components
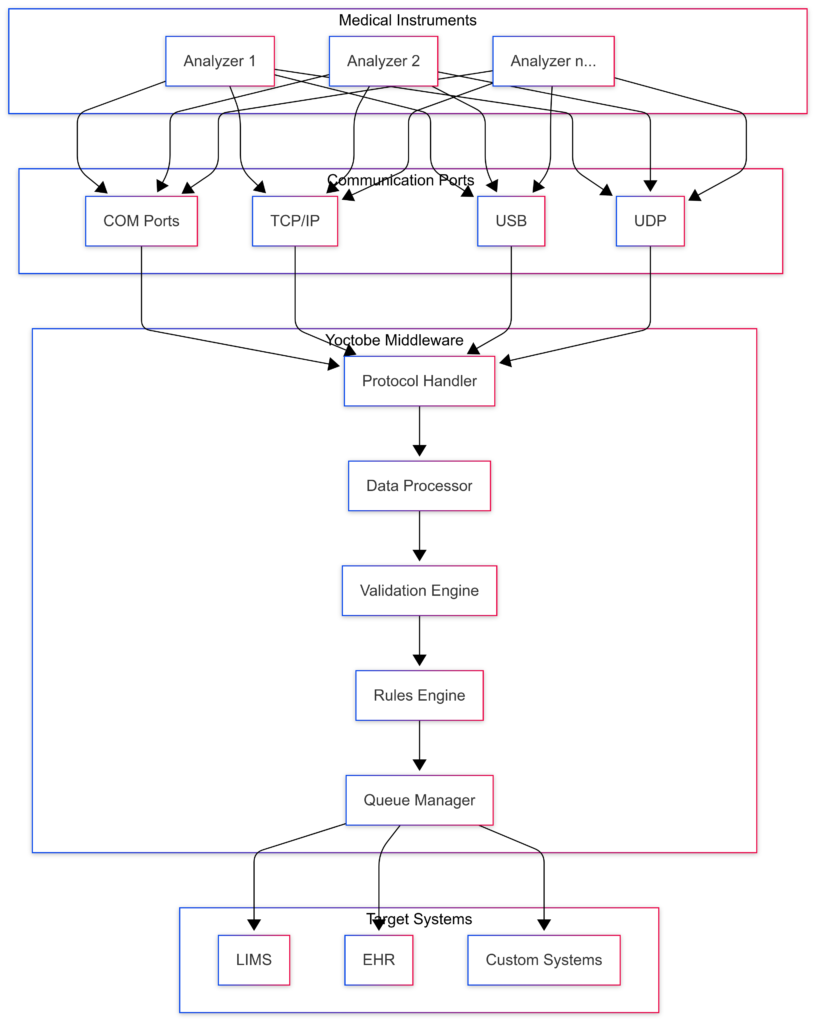
The Protocol Handler serves as the primary interface for incoming data streams. It automatically detects and adapts to various protocols including ASTM, HL7, and proprietary formats. This component handles all low-level communication details, managing handshaking, acknowledgments, and error recovery.
The Data Processor performs real-time normalization of incoming data. It converts diverse data formats into a standardized internal structure, enabling consistent processing regardless of the source instrument or protocol. This component handles:
- Character encoding conversion
- Message segmentation and reassembly
- Data type normalization
- Unit standardization
Communication Infrastructure
The middleware supports multiple communication channels simultaneously, with automatic failover capabilities. Each channel operates independently, allowing for parallel processing of multiple instrument connections.
Supported connection types include:
- Serial COM ports with configurable parameters
- TCP/IP with both server and client modes
- USB connections with device detection
- UDP for specialized applications
Data Processing Pipeline
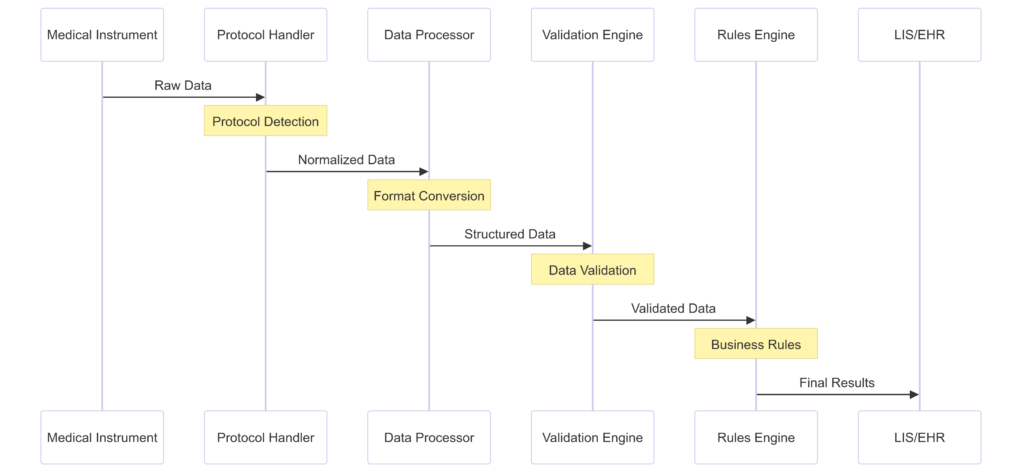
The system implements a robust processing pipeline that ensures data integrity and proper routing. Each stage of processing provides specific guarantees:
Protocol Detection Stage The system automatically identifies incoming protocols and adapts its processing accordingly. This includes handling of hybrid protocols that mix binary and text data.
Format Conversion Stage Incoming data undergoes normalization to ensure consistency across different sources. The system maintains mapping tables for standardizing:
Test codes Unit measurements Result formats Reference ranges
Advanced Features
Real-time Processing The middleware processes data in real-time with minimal latency. The system employs sophisticated queuing mechanisms to handle high-volume data streams while maintaining data integrity.
Error Recovery Automatic error recovery mechanisms handle common failure scenarios:
Network interruptions trigger automatic reconnection attempts Corrupted messages are identified and logged Invalid data is quarantined for manual review Processing errors trigger notifications
Integration Capabilities
The middleware provides flexible integration options for existing systems:
Database Integration
- Direct database connections with major RDBMS
- Support for custom SQL queries
- Transaction management
- Connection pooling
File System Integration The system can monitor and process files from multiple sources:
Network shares Local directories FTP/SFTP locations Cloud storage systems
Performance Considerations
Resource Requirements The middleware is optimized for efficient resource usage:
Memory: Base 4GB, scales with number of connections CPU: Multi-threaded support for parallel processing Storage: Minimal requirements for operation, configurable logging levels
Scalability The system scales horizontally to handle increasing loads:
Additional instruments can be added without service interruption Processing rules can be modified in real-time New protocols can be added through configuration updates
Security Features
The middleware implements comprehensive security measures:
Data Protection
- TLS encryption for network communications
- Data encryption at rest
- Secure credential storage
- Audit logging of all operations
Access Control Role-based access control with granular permissions Authentication integration with Active Directory/LDAP Session management and timeout controls
Support and Maintenance
The system includes tools for ongoing maintenance:
Monitoring Dashboard
- Real-time connection status
- Message processing statistics
- Error rates and types
- System resource usage
Troubleshooting Tools
- Protocol analyzers
- Message tracers
- Log aggregation
- Performance profilers


